PT-PT
PT-PT
 FR
FR
 ES
ES
 DE
DE
 AR
AR
 PL
PL
 UA
UA
 ID
ID
 VN
VN
 IT
IT
 GE
GE
 UZ
UZ
 CN
CN
 KZ
KZ
 CZ
CZ


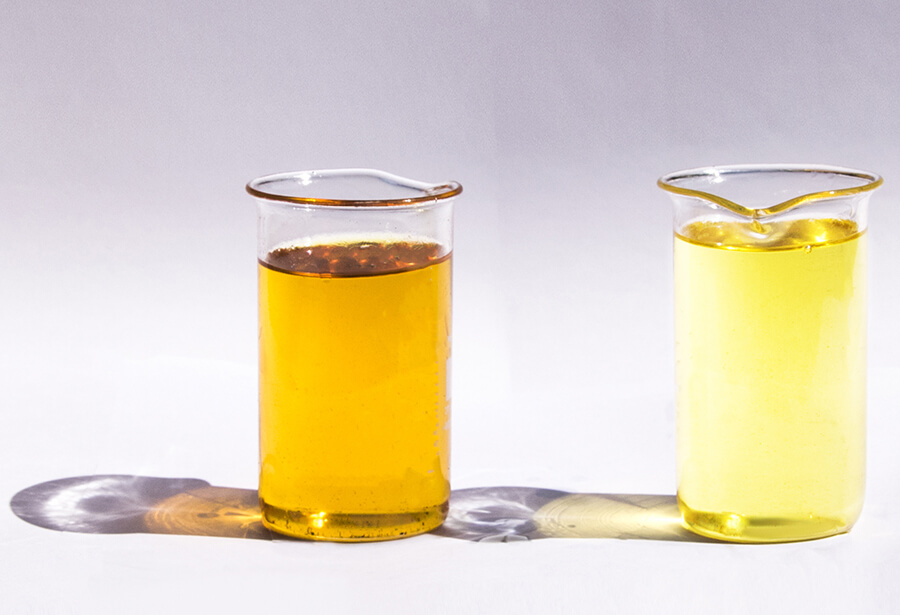
Transformer oil is widely used as coolant, insulator and suppressor of the arc in electrical devices. The composition of transformer oil includes naphthenes, paraffins and aromatic hydrocarbons. The mass fraction of other components, as a rule, does not exceed 4-5% (for a fresh product).
Transformer oil operating performance
Performance of transformer oil is evaluated by the following parameters:
- dielectric loss tangent. The sufficient dielectric strength of oil is ensurred through removal of water and mechanical impurities;
- pour point. The lower is the pour point, the better the oil performs at low temperatures;
- viscosity. This parameter should have a minimum value, which will allow good heat removal from hot parts;
- oxidation stability. Oil should not be strongly oxidized during a prolonged operation. This characteristic is improved by adding special inhibitors;
- flash point must not exceed 135 ° C. When oil is heated below the specified value, there will be no oil ignition.
Transformer Oil Functions
Transformer oils perform at least four functions for the transformer. Oil provides insulation, provides cooling, and helps extinguish arcs. Oil also dissolves gases generated by oil degradation, moisture and gas from cellulose insulation, deterioration, and gases and moisture from exposure to atmospheric conditions. Close observation of dissolved gases in the oil, and other oil properties, provides the most valuable information about transformer health. Looking for trends by comparing information provided in several DGAs and understanding its meaning is the most important transformer diagnostic tool.
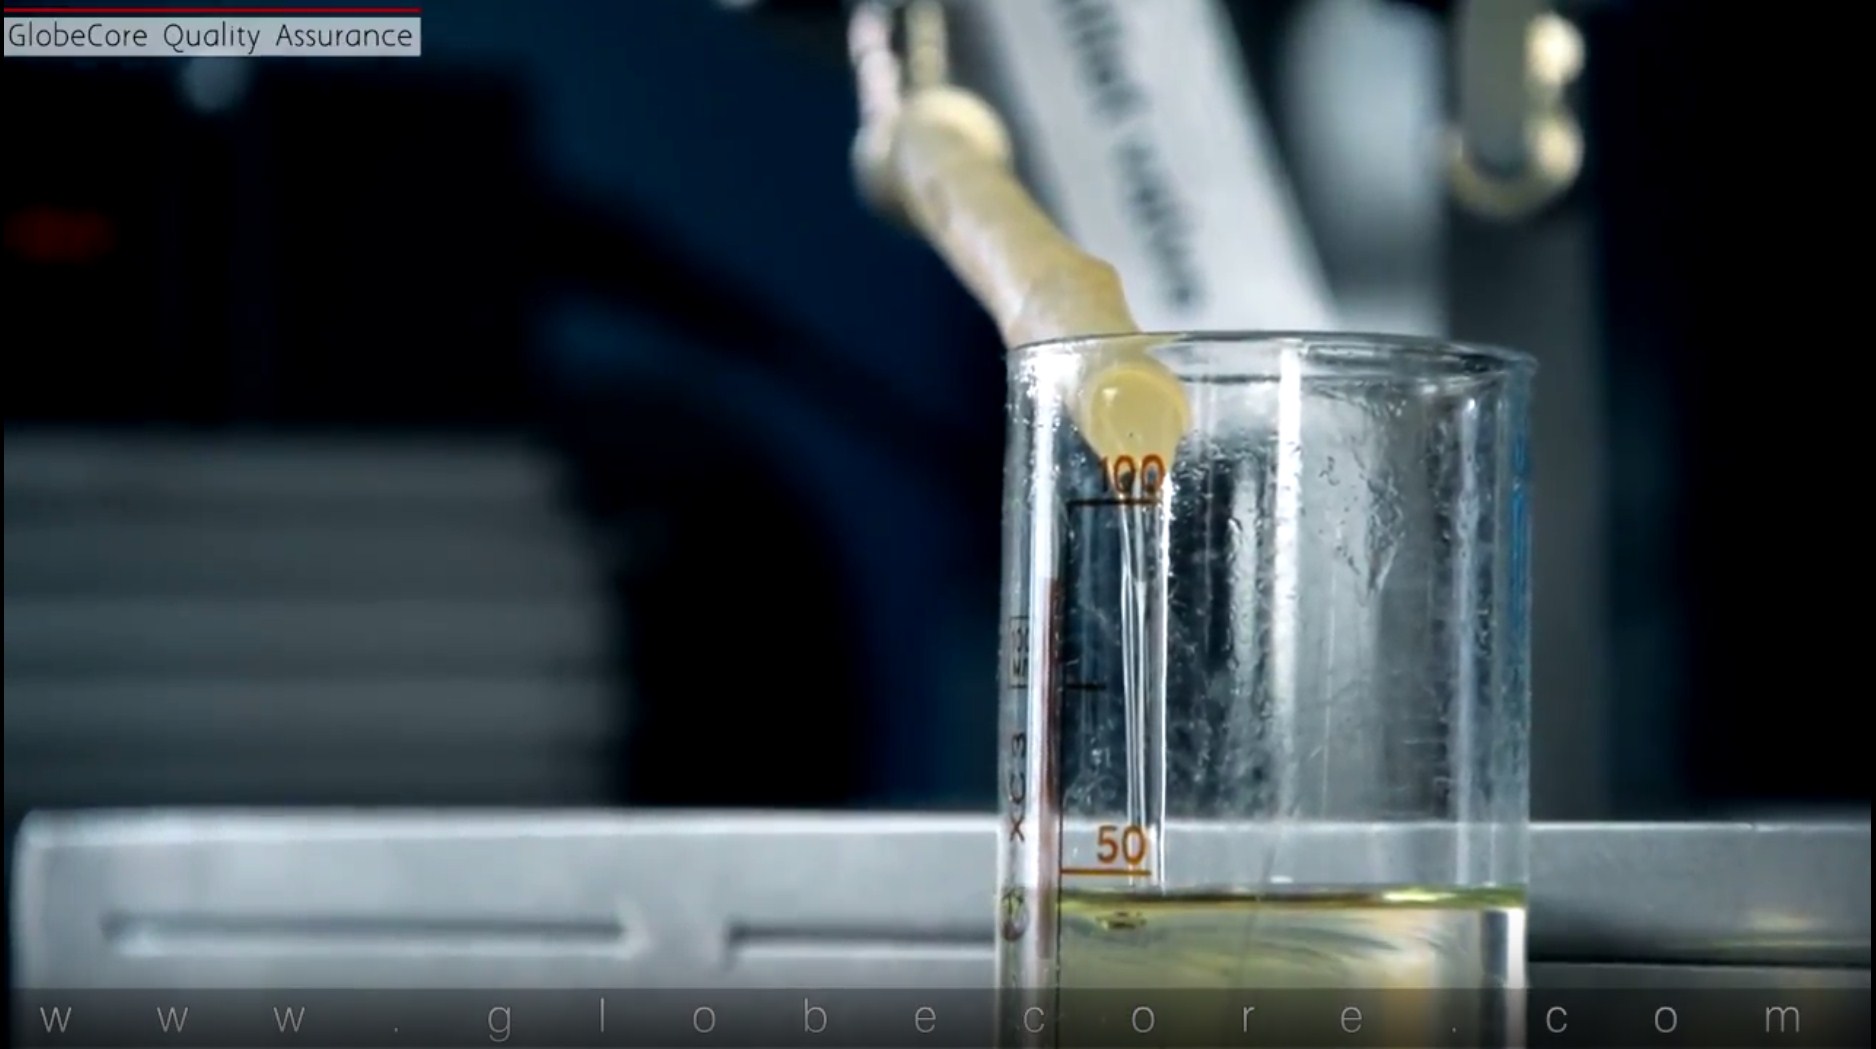
Dissolved Gas Analysis
After 1 month of service and once each year, and more often if a problem is encountered, complete a DGA. This is, by far, the most important tool for determining the health of a transformer. A DGA is the first indicator of a problem and can identify deteriorating insulation and oil, overheating, hot spots, partial discharge, and arcing. The Ahealth@ of the oil is reflective of the health of the transformer itself. A dissolved gas analysis consists of sending transformer oil samples to a commercial laboratory for testing. The most important indicators are the individual and total combustible gas (TCG) generation rates based on the International Electrotechnical Commission (IEC) 60599 [13] and IEEE C 57-104™ [12] standards.
CAUTION:
DGA is unreliable if the transformer is de-energized and has cooled, if the transformer is new, or if it has had less than 1 to 2 weeks of continuous service after oil processing.
This section provides guidance in interpreting DGA and suggests actions based on the analysis. There are no “quick and sure” easy answers when dealing with transformers. Transformers are very complex, very expensive, and very important to Reclamation; and each one is different.
Decisions must be based on experienced judgment founded on all available data and consultation with experienced people. Periodic DGA and proper interpretations, along with thorough periodic inspections (covered earlier), are the most important keys to transformer life. Each DGA must be compared to prior DGAs to recognize trends and establish rates of gas generation .
Although examples will be presented later, there are no universally accepted means for interpreting DGA data [16]. Transformers are very complex. Aging, chemical actions and reactions, electric fields, magnetic fields, thermal contraction and expansion, load variations, gravity, and other forces all interact inside the tank. Externally, through-faults, voltage surges, wide ambient temperature changes, and other forces (i.e., the earth’s magnetic field and gravity) affect the transformer.
There are few, if any, “cut and dried” DGA interpretations; even experts disagree. Consultation with others, experience, study, comparing earlier DGAs, keeping accurate records of a transformer’s history, and noting information found when a transformer is disassembled will increase expertise and provide life extension to this critical equipment.
Keeping accurate records of each individual transformer is paramount. If a prior through-fault, overload, cooling problem, or nearby lightning strike has occurred, this information is extremely valuable to determine what is going on inside the transformer. Baseline transformer test information should be established when the transformer is new, or as soon as possible thereafter. This must include DGA, Doble, and other test results (discussed in section 9, “Transformer Testing”). Table 6 represents a summary of DGA transformer analysis. Table 7 is an actual example of a Reclamation transformer.


CAUTION:
Transformer engineering expertise is needed in the use of this table. The action required may be as simple as sending an additional transformer oil sample to the lab or as complex as conducting extensive testing on the transformer. It may also include repairs, internal inspection, and/or complete
replacement of the transformer.
The condition ranges shown represent a composite of IEEE C57-104, IEC 60599, Delta X Research’s Transformer Oil Analysis, and many years of transformer experience. The table above was compiled by Clarence Herron of the Glen Canyon Field Office of Reclamation.
Key Gas Method
The key gas method of interpreting DGA is set forth in IEEE [12]. Key gases formed by degradation of oil and paper insulation are hydrogen (H2), methane (CH4), ethane (C2H6), ethylene (C2H4), acetylene (C2H2), carbon monoxide (CO), and oxygen (O2). Except for carbon monoxide and oxygen, all these gases are formed from the degradation of the oil itself. Carbon monoxide, carbon dioxide (CO2), and oxygen are formed from degradation of cellulose (paper) insulation. Carbon dioxide, oxygen, nitrogen (N2), and moisture can also be absorbed from the air, if there is an oil/air interface or if there is a leak in the tank.
Some of our transformers have a pressurized nitrogen blanket above the oil and, in these cases, nitrogen may be near saturation (see table 8). Gas type and amounts are determined by where the fault occurs in the transformer and the severity and energy of the event. Events range from low energy events, such as partial discharge, producing hydrogen and trace amounts of methane and ethane, to very high energy sustained arcing, capable of generating all the gases, including acetylene, requiring the most energy.
Four-Condition DGA Guide (IEEE C57-104) – A four-condition DGA guide to classify risks to transformers with no previous problems has been published in the Standard IEEE Standard (Std) [20], C57-104™. The guide uses combinations of individual gases and total combustible gas concentration as indicators. It is not universally accepted and is only one of the tools used to evaluate dissolved gas in transformers. The four IEEE® conditions are defined below, and gas levels are in table 8.

CAUTION:
Transformers generate some combustible gases from normal operation, and condition numbers for dissolved gases given in IEEE C57-104-1991™ [12] (table 8 above) are extremely conservative. Transformers can operate safely with individual gases in Condition 4 with no problems, provided they are stable and gases are not increasing or are increasing very slowly. If TDCG and individual gases are significantly increasing (more than 30 ppm per day [ppm/day]), an active fault is in progress. The transformer should be de-energized when Condition 4 levels are reached.
- Condition 1: Total dissolved combustible gas (TDCG) below this level indicates the transformer is operating satisfactorily.
Any individual combustible gas exceeding specified levels in table 8 should have additional investigation.
- Condition 2: TDCG within this range indicates greater than normal combustible gas level. Any individual combustible gas exceeding specified levels in table 8 should have additional investigation. A fault may be present. Take DGA samples at least often enough to calculate the amount of gas generation per day for each gas. (See table 9 for recommended sampling frequency and actions.)
- Condition 3: TDCG within this range indicates a high level of decomposition of cellulose insulation and/or oil. Any individual combustible gas exceeding specified levels in table 6 should have additional investigation. A fault or faults are probably present. Take DGA samples at least often enough to calculate the amount of gas generation per day for each gas (see table 9).
- Condition 4: TDCG within this range indicates excessive decomposition of cellulose insulation and/or oil. Continued operation could result in failure of the transformer (see table 9).
A sudden increase in key gases and the rate of gas production is more important in evaluating a transformer than the accumulated amount of gas. One very important consideration is acetylene (C2H2). Generation of any amount of this gas above a few ppm indicates high-energy arcing.
Trace amounts (a few ppm) can be generated by a very hot thermal fault (500 EC or higher). A one-time arc, caused by a nearby lightning strike or a high-voltage surge, can also generate a small amount of C2H2. If C2H2 is found in the DGA, oil samples should be taken weekly, or even daily, to determine if additional C2H2 is being generated.
If no additional acetylene is found and the level is below the IEEE® Condition 4, the transformer may continue in service. However, if acetylene continues to increase, the transformer has an active high-energy internal arc and should be taken out of service immediately. Further operation is extremely hazardous and may result in explosive catastrophic failure of the tank, spreading flaming oil over a large area.
Table 9 assumes that no previous DGA tests were performed on the transformer or that no recent history exists. If a previous DGA exists, it should be reviewed to determine if the situation is stable (gases are not increasing significantly) or unstable (gases are increasing significantly).

NOTES:
- Either the highest condition based on individual combustible gas or TDCG can determine the condition (1, 2, 3, or 4) of the transformer. For example, if the TDCG is between 1,941 ppm and 2,630 ppm, this indicates Condition 3. However, if hydrogen is greater than 1,800 ppm, the transformer is in Condition 4, as shown in table 8.
- When the table says Adetermine load dependence,” this means to try to find out if the gas generation rate in ppm/day goes up and down with the load. The transformer may be overloaded or have a cooling problem. Take oil samples every time the load changes; if load changes are too frequent, this may not be possible.
- To get the TDCG generation rate, divide the change in TDCG by the number of days between samples that the transformer has been loaded. Down days should not be included. The individual gas generation rate in ppm/day is determined by the same method.
Before going to table 11, determine the transformer status from table 10; that is, look at the DGA and see if the transformer is in Condition 1, 2, 3, or 4. The condition for a particular transformer is determined by finding the highest level for any individual gas or by using the TDCG [12]. Either the individual gas or the TDCG can give the transformer a higher condition number, which means it is at greater risk. If the TDCG number shows the transformer in Condition 3 and an individual gas shows the transformer in Condition 4, the transformer is in Condition 4. Always be conservative and assume the worst until proven otherwise.
Sampling Intervals and Recommended Actions
When sudden increases occur in dissolved gases, the procedures recommended in table 9 should be followed. Table 9 is paraphrased from table 3 in IEEE C57.104-1991 [12]. To make it easier to read, the order has been reversed with Condition 1 (lowest risk transformer) at the top and Condition 4 (highest risk) at the bottom. The table indicates the recommended sampling intervals and actions for various levels of TDCG in ppm.
An increasing gas generation rate indicates a problem of increasing severity; therefore, as the generation rate (ppm/day) increases, a shorter sampling interval is recommended (see table 9). Some information has been added to the table from IEEE C57-104-1991 (inferred from the text). To see the exact table, refer to the IEEE Standard [12].
If the cause of gassing can be determined and the risk can be assessed, the sampling interval may be extended. For example, if the core is meggered and an additional core ground is found, even though table 9 may recommend a monthly sampling interval, an operator may choose to lengthen the sampling interval, because the source of the gassing and generation rate is known.
A decision should never be made on the basis of just one DGA. It is very easy to contaminate the sample by accidentally exposing it to air.
Mislabeling a sample is also a common cause of error. Mislabeling could occur when the sample is taken, or it could be accidentally contaminated or mishandled at the laboratory. Mishandling may allow some gases to escape to the atmosphere and other gases, such as oxygen, nitrogen, and carbon dioxide, to migrate from the atmosphere into the sample. If you notice a transformer problem from the DGA, the first thing to do is take another sample for comparison.
The gas generation chart (figure 48) [14, 17] and the discussion below represent only an approximate temperature at which gases form. The figure is not drawn to scale and is only for purposes of illustrating temperature relationships, gas types, and quantities. These relationships represent what generally has been proven in controlled laboratory conditions using a mass spectrometer. This chart was used by R.R. Rogers of the Central Electric Generating Board (CEGB) of England to develop the “Rogers Ratio Method” of analyzing transformers (discussed in section 6.1.9.4).
A vertical band on the left of the chart shows what gases and approximate relative quantities are produced under partial discharge conditions. Note that all the gases are given off, but in much less quantity than hydrogen. It takes only a very low energy event (partial discharge/corona) to cause hydrogen molecules to form from the oil. Gases are formed inside an oil-filled transformer similar to a petroleum refinery still, where various gases begin forming at specific temperatures.
From the Gas Generation Chart, we can see relative amounts of gas as well as approximate temperatures. Hydrogen and methane begin to form in small amounts around 150 ºC. Notice from the chart that beyond maximum points, methane (CH4), ethane and ethylene production goes down as temperature increases.
At about 250 ºC, production of ethane (C2H6) starts. At about 350 ºC, production of ethylene (C2H4) begins. Acetylene (C2H2) production begins between 500 ºC and 700 ºC. In the past, the presence of only trace amounts of acetylene (C2H2) was considered to indicate that a temperature of at least 700 ºC had occurred; however, recent discoveries have led to the conclusion that a thermal fault (hot spot) of 500 ºC can produce trace amounts (a few ppm). Larger amounts of acetylene can only be produced above 700 ºC by internal arcing.
Notice that between 200 ºC and 300 ºC, the production of methane exceeds hydrogen. Starting at about 275 ºC and on up, the production of ethane exceeds methane. At about 450 ºC, hydrogen production
exceeds all others until about 750 ºC to 800 ºC; then more acetylene is produced.

It should be noted that small amounts of H2, CH4, and CO are produced by normal aging. Thermal decomposition of oilimpregnated cellulose produces CO, CO2 , H2, CH4, and O2. Decomposition of cellulose insulation begins at only about 100 ºC or less. Therefore, operation of transformers at no more than 90 ºC is imperative. Faults will produce internal “hot spots” of far higher temperatures than these, and the resultant gases show up in the DGA. Table 11 (later in this section) is a chart of “fault types,” parts of which are paraphrased from the IEC 60599 [13].
This chart is not complete. It is impossible to chart every cause and effect due to the extreme complexity of transformers. DGAs must be carefully examined with the idea of determining possible faults and possible courses of action. These decisions are based on judgment and experience and are seldom “cut and dried.” Most professional associations agree that there are two basic fault types, thermal and electrical. The first three on the chart are electrical discharges, and the last three are thermal faults.
Ethane and ethylene are sometimes called “hot metal gases.” When these gases are generated and acetylene is not, the problem found inside the transformer normally involves hot metal. This may include bad contacts on the tap changer or a bad connection somewhere in the circuit, such as a main transformer lead. Stray flux impinging on the tank (such as in Westinghouse 7M series transformers) can cause these “hot metal gases.” Sometimes, a shield becomes loose and falls and becomes ungrounded. Static can then build up and discharge to a grounded surface, producing “hot metal” gases. An unintentional core ground with circulating currents can also produce these gases. There are many other examples.
Notice that both types of faults (thermal and electrical) may be occurring at the same time, and one may cause the other. The associations do not mention magnetic faults; however, magnetic faults (such as stray magnetic flux impinging the steel tank or other magnetic structures) also cause hot spots.
Atmospheric Gases
Atmospheric gases (N2, CO2, and O2) can be very valuable in a DGA in revealing a possible leak. However, as mentioned elsewhere, there are other reasons these gases are found in DGAs. Nitrogen may exist from shipping the transformer with N2 inside or from a nitrogen blanket. CO2 and O2 are formed by degradation of cellulose. Be very careful; look at several DGAs and see if atmospheric gases and, possibly, moisture levels are increasing. Also, carefully look at the transformer to see if you can find an oil leak. Moisture and atmospheric gases will leak inside when the transformer is off and the ambient temperature drops (see section 6.1.11 on moisture).
Dissolved Gas Software
Several companies offer DGA computer software that diagnoses transformer problems. These diagnoses must be used with engineering judgment and should never be taken at face value. The software is constantly changing. The Technical Service Center uses “Transformer Oil Analyst” (TOA) by Delta X Research that uses a composite of several current DGA methods. Dissolved gas analysis help is available from the TSC through the D-8440 and D-8450 groups. Both groups have the above software and experience in diagnosing transformer problems.
One set of rules that TOA uses to generate alarms is based loosely on IEC 60599 (table 10). These rules are also very useful in daily dissolved gas analysis, which are based on L1 limits of IEC 60599, except for acetylene. IEC 60599 gives a range for L1 limits instead of a specific value. TOA uses the average in this range and then gives the user a “heads up” if a generation rate exceeds 10% of L1 limits per month. Acetylene is the exception; IEEE sets an L1 limit of 35 ppm (too high), and IEC sets an acetylene range of 3 to 50. TOA picks the lowest number (3 ppm) and sets the generation rate alarm value at 3 ppm per month. L1 limits are the quantities at which you should begin to watch the transformer more closely (i.e., the first level of concern).

NOTE:
If one or more gas generation rates are equal to or exceed G1 limits (10% of L1 limits per month), you should begin to pay more attention to this transformer. Reduce the DGA sample interval, reduce loading, plan for future outage, contact the manufacturer, etc.
If one or more combustible gas generation rates are equal to or exceed G2 limits (50% of L1 limits per month), this transformer should be considered in critical condition. You may want to reduce sample intervals to monthly or weekly, plan an outage, plan to rebuild or replace the transformer, etc. If an active arc is present (C2H2 generation), or if other heat gases are high (above Condition 4 limits in table 8), and G2 limits are exceeded, the transformer should be de-energized. Table 11 is taken from IEC 60599 and contains possible faults and possible findings. This chart is not all inclusive and should be used with other information. Additional possible faults are listed on the
following and preceding pages.
Transformers are so complex that it is impossible to put all symptoms and causes into a chart. Several additional transformer problems are listed below; any of these may generate gases:
- Gases are generated by normal operation and aging, mostly H2 and CO, with some CH4. H2 is the easiest gas to produce except possibly CO. Production of H2 and other gases can be caused by partial discharge (corona), sharp corners on bottom bushing connectors, loose core ground, wet spot on core from gasket leak above, loose corona shield on bottom of bushing, loose tap changer shield, etc. H2 is not very stable when dissolved in oil. Consecutive DGAs may show variation in
amounts of H2 and other unstable gases. Acetylene is the most stable gas; variation in amounts of this gas in the upward direction means the transformer has an active arcing fault. If the variation is going up and down within detection limits of the test equipment (section 6.1.9.4, table 14) in
consecutive DGAs, this is simply a variation of the lab’s test equipment and personnel. - Operating transformers at sustained overload will generate combustible gases.
- Problems with cooling systems, discussed in sections 3.3.1 and 3.4.5, can cause overheating.
- A blocked oil duct inside the transformer can cause local overheating, generating gases.
- An oil directing baffle loose inside the transformer causes misdirection of cooling oil.
- Oil circulating pump problems (bearing wear, impeller loose or worn, or pump running in reverse) can cause transformer cooling problems.
- Oil level is too low; this will not be obvious if the level indicator is inoperative.
- Sludge in the transformer and cooling system (see section 3.4.5.4).
- Circulating stray currents may occur in the core, structure, and/or tank.
- An unintentional core ground may cause heating by providing a path for stray currents.
- A hot-spot can be caused by a bad connection in the leads or by a poor contact in the tap changer.
- A hot-spot may also be caused by discharges of static electrical charges that build up on shields or core and structures and that are not properly grounded.
- Hot-spots may be caused by electrical arcing between windings and ground, between windings of different potential, or in areas of different potential on the same winding, due to deteriorated or damaged insulation.
- Windings and insulation can be damaged by faults downstream (through faults), causing large current surges through the windings. Through faults cause extreme magnetic and physical forces that can distort and loosen windings and wedges. The results may be arcing in the transformer, beginning at the time of the fault, or the insulation may be weakened and arcing will develop later.
- Insulation can also be damaged by a voltage surge, such as a nearby lightning strike, switching surge, or closing out of step, which may result in immediate arcing or arcing that develops later.
- Insulation may be deteriorated from age and worn out. Clearances and dielectric strength are reduced, allowing partial discharges and arcing to develop. This can also reduce physical strength, allowing wedging and windings to move extensively during a through-fault, causing total mechanical and electrical failure.
- High noise level (hum due to loose windings or core laminations) can generate gas due to heat from friction. Compare the noise to sister transformers, if possible. Sound level meters are available at the TSC for diagnostic comparison and to establish baseline noise levels for future comparison.

Temperature
Gas production rates increase exponentially with temperature and directly with volume of oil and paper insulation at high enough temperature to produce gases [12]. Temperature decreases as distance from the fault increases. Temperature at the fault center is highest, and oil and paper, here, will produce the most gas. As distance increases from the fault (hot spot), temperature goes down, and the rate of gas generation also goes down. Because of the volume effect, a large heated volume of oil and paper will produce the same amount of gas as a smaller volume at a higher temperature [12]. We cannot tell the difference by looking at the DGA. This is one reason that interpreting DGAs is not an exact science.
Gas Mixing
Concentration of gases in close proximity to an active fault will be higher than in the DGA oil sample. As distance increases from a fault, gas concentrations decrease. Equal mixing of dissolved gases in the total volume of oil depends on time and oil circulation. If there are no pumps to force oil through radiators, complete mixing of gases in the total oil volume takes longer. With pumping and normal loading, complete mixing equilibrium should be reached within 24 hours and will have little effect on DGA if an oil sample is taken 24 hours or more after a problem begins.
Gas Solubility
Solubilities of gases in oil vary with temperature and pressure [14]. Solubility of all transformer gases vary proportionally up and down with pressure. Variation of solubilities with temperature is much more complex. Solubilities of hydrogen, nitrogen, carbon monoxide, and oxygen go up and down proportionally with temperature. Solubilities of carbon dioxide, acetylene, ethylene, and ethane are reversed and vary inversely with temperature changes. As temperature rises, solubilities of these gases go down; and as temperature falls, their solubilities increase. Methane solubility remains almost constant with temperature changes.
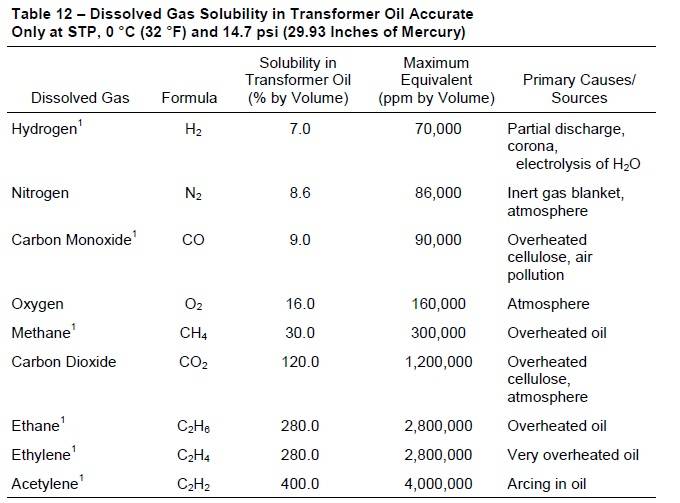
Table 12 is accurate only at standard temperature and pressure (STP), (0 ºC/32 ºF) and (14.7 psi/29.93 inches of mercury, which is standard barometric pressure at sea level). Table 12 shows only relative differences in how gases dissolve in transformer oil. From the solubility table (table 12) below, comparing hydrogen with a solubility of 7% and acetylene with a solubility of 400%, you can see that transformer oil has a much greater capacity for dissolving acetylene. However, 7% hydrogen by volume represents 70,000 ppm, and 400% acetylene represents 4,000,000 ppm. You probably will never see a DGA with numbers this high. Nitrogen can approach maximum level if there is a pressurized nitrogen blanket above the oil.
Table 12 shows the maximum amount of each gas that the oil is capable of dissolving at standard temperature and pressure. At these levels, the oil is said to be saturated.
If you have conservator-type transformers and nitrogen, oxygen, and CO2 are increasing, there is a good possibility that the tank has a leak or that the oil may have been poorly processed. Check the diaphragm or bladder for leaks (section 4.9) and check for oily residue around the pressure relief device and other gasketed openings. There should be fairly low nitrogen and especially low oxygen in a conservator-type transformer. However, if the transformer was shipped new with pressurized nitrogen inside and has not been de-gassed properly, there may be high nitrogen content in the DGA, but the nitrogen level should not be increasing after the transformer has been in service for a few years. When oil is installed in a new transformer, a vacuum is placed on the tank that pulls out nitrogen and pulls in the oil.
Transformer Oil is free to absorb nitrogen at the oil/gas interface, and some nitrogen may be trapped in the windings, paper insulation, and structure. In this case, nitrogen may be fairly high in the DGAs. However, oxygen should be very low, and nitrogen should not be increasing. It is important to take an oil sample early in the transformer’s service life to establish a baseline DGA; then take samples at least annually. The nitrogen and oxygen can be compared with earlier DGAs. If they increase, it is a good indication of a leak. If the transformer oil has ever been de-gassed, nitrogen and oxygen should be low in the DGA. It is extremely important to keep accurate records over a transformer’s life; when a problem occurs, recorded information helps greatly in troubleshooting.
1 Denotes combustible gas. Overheating can be caused both by high temperatures and by unusual or abnormal electrical stress.
Diagnosing a Transformer Problem Using Dissolved Gas ,Analysis and the Duval Triangle
![]()
CAUTION:
Do not use the Duval Triangle (figure 49) to determine whether or not a transformer has a problem. Notice, there is no area on the triangle for a transformer that does not have a problem. The triangle will show a fault for every transformer whether it has a fault or not. Use the above IEEE method or table 13 to determine if a problem exists before applying the Duval Tirangle. The Duval Triangle is used only to determine what the problem is. As with other methods, a significant amount of gas (at least L1 limits and G2 generation rates in table 13) must already be present before this method is valid.
Origin of the Duval Triangle – Michel Duval of Hydro Quebec developed this method in the 1960s using a database of thousands of DGAs and transformer problem diagnosis. More recently, this method was incorporated in the Transformer Oil Analyst Software version 4 (TOA 4), developed by Delta X Research and used by many in the utility industry to diagnose transformer problems. This method has proven to be accurate and dependable over many years and is now gaining in popularity. The method and how to use it are described below.
How to Use the Duval Triangle
1. First determine whether a problem exists by using the IEEE® method above, and/or table 13 below. At least one of the hydrocarbon gases or hydrogen must be in IEEE® Condition 3 and increasing at a generation rate (G2), from table 13, before a problem is confirmed. To use table 13 without the IEEE® method, at least one of the individual gases must be at L1 level or above and the gas generation rate must be at least at G2.
The L1 limits and gas generation rates from table 13 are more reliable than the IEEE® method; however, one should use both methods to confirm that a problem exists. If there is a sudden increase in H2 with only carbon monoxide and carbon dioxide and little or none of the hydrocarbon gases, use section 6.1.10 (CO2/CO ratio) to determine if the cellulose insulation is being degraded by overheating.
2. Once a problem has been determined to exist, use the total accumulated amount of the three Duval Triangle gases and plot the percentages of the total on the triangle to arrive at a diagnosis. An example is shown below. Also, calculate the amount of the three gases used in the Duval Triangle, generated since the sudden increase in gas began. Subtracting out the amount of gas generated prior to the sudden increase will give the amount of gases generated since the fault began. Detailed instructions and an example are shown below.
a. Take the amount (ppm) of methane in the DGA and subtract the amount of CH4 from an earlier DGA, before the sudden increase in gas. This will give the amount of methane generated since the problem started.
b. Repeat this process for the remaining two gases, ethylene and acetylene.
3. Add the three numbers (differences) obtained by the process of step 2 above. This gives 100 % of the three key gases, generated since the fault, used in the Duval Triangle.
4. Divide each individual gas difference by the total difference of gas obtained in step 3 above. This gives the percentage of increase of each gas of the total increase.
5. Plot the percentage of each gas on the Duval Triangle, beginning on the side indicated for that particular gas. Draw lines across the triangle for each gas, parallel to the hash marks shown on each side of the triangle. An example is shown below.
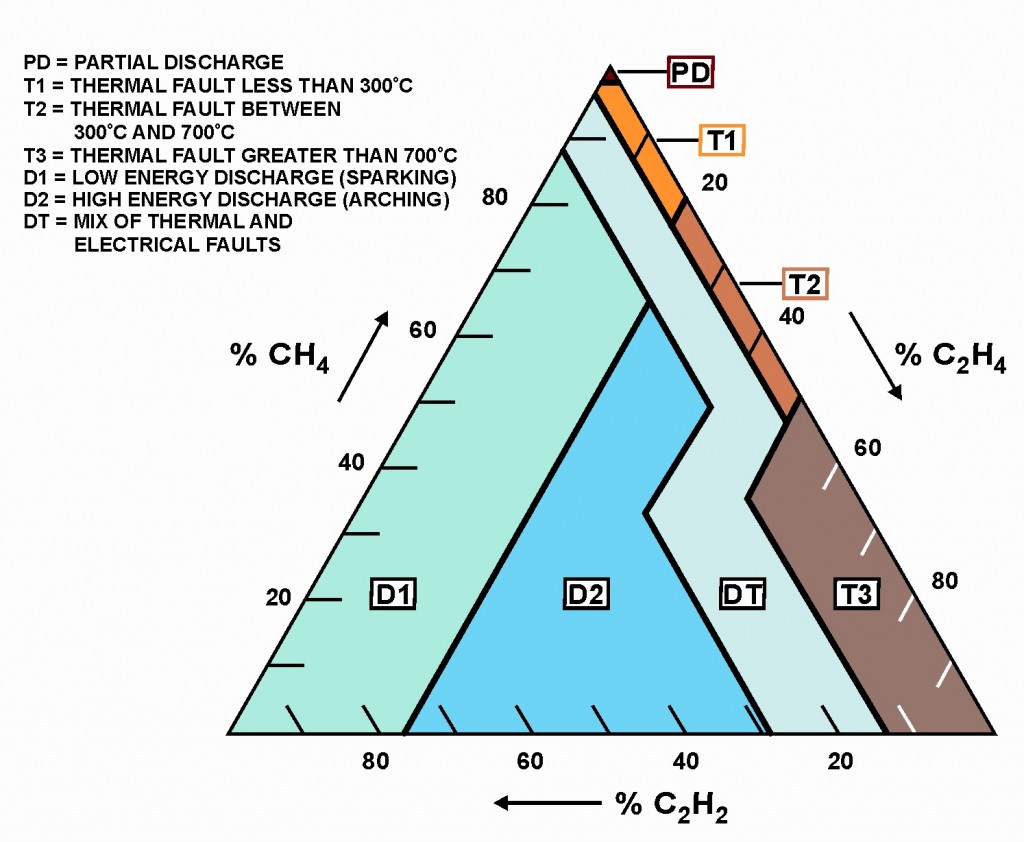


NOTE:
In most cases, acetylene will be zero, and the result will be a point on the right side of the Duval Triangle.
Compare the total accumulated gas diagnosis and the diagnosis obtained by using only the increase-in-gases after a fault. If the fault has existed for some time, or if generation rates are high, the two diagnoses will be the same. If the diagnoses are not the same, always use the diagnosis of the increase in gases generated by the fault, which will be the more severe of the two. See the example below of a Reclamation transformer where the diagnosis using the increase in gas is more severe than when using the total accumulated gas.
Example: Using figure 50 and the information below, two diagnoses of a Reclamation transformer were obtained. The first diagnosis (Point 1) was obtained using the total amount of the three gases used by the Duval Triangle. The second diagnosis (Point 2) was obtained using only the increase in gases between the two DGAs. CO and CO2 are used to evaluate cellulose.

Steps to Obtain the First Diagnosis (Point 1) on the Duval Triangle (Figure 50)
- Use the total accumulated gas from DGA 2 = 369
- Divide each gas by the total to find the percentage of each gas of the total. % CH4 = 192/369 = 52%, % C2H4 = 170/369 = 46%, % C2H2 = 7/369 = 2%
- Draw three lines across the Duval Triangle starting at the percentages obtained in step 2. These lines must be drawn parallel to the hash mark on each respective side. See the black dashed lines in figure 50 above.
- Point 1 is obtained where the lines intersect within the T2 diagnostic area of the triangle, which indicates a thermal fault between 300 and 700 °C. See figure 49, Legend, above. Steps to Obtain the Second Diagnosis (Point 2) on the Duval Triangle (Figure 50)
- Use the total increase in gas = 139.
- Divide each gas increase by the total increase to find the percentage of each gas of the total:
- % increase CH4 = 50/139 = 36%
- % increase C2H4 = 86/139 = 46%
- % increase C2H2 = 3/139 = 2%
- Draw three lines across the Duval Triangle starting at the percentages obtained in step 2. These lines must be drawn parallel to the hash mark on each respective side. See the white dashed lines in figure 50 above. Note that C2H2 was the same percentage (2%) both times; and, therefore, both lines are the same
- Point 2 is obtained where the lines intersect within the T3 diagnostic area of the triangle, which indicates a thermal fault greater than 700 °C. See figure 49, Legend, above. The ratio of total accumulated gas is CO2/CO = 2,326/199 = 11.7. The ratio of increase is CO2/CO = 1,317/23 = 57. Neither of these ratios is low enough to cause concern. This shows that the thermal fault is not close enough to the cellulose insulation to cause heat degradation of the insulation. The large increase in CO2 could mean an atmospheric leak.
NOTE:
- Point 2 is the more severe diagnosis obtained by using the increase in gas rather than the total accumulated gas. It is helpful to perform both methods as a check; many times both diagnoses will come out the same.
- CO and CO2 are included to show that the fault does not involve severe degradation of cellulose insulation. See section 6.1.10 for an explanation of CO2/CO ratios.
The fault is probably a bad connection on a bushing bottom, a bad contact or connection in the tap changer, or a problem with a core ground. These problems are probably all reparable in the field. Any of these problems can cause the results revealed by the Duval Triangle diagnosis above. These are areas where a fault will not degrade cellulose insulation, which would cause the CO2/CO ratio to be much lower than what was obtained. For information to arrive at a probable
fault see section 6.1.10.
Expertise Needed – A transformer expert should be consulted if a problematic trend is evidenced by a number of DGAs. The transformer manufacturer should be consulted along with DGA lab personnel and others experienced in transformer maintenance and diagnostics. Never make a diagnosis based on one DGA; a sample may have been mishandled or mislabeled, either in the field or lab.
Rogers Ratio Method of DGA – Rogers Ratio Method of DGA [19] is an additional tool that may be used to look at dissolved gases in transformer oil. Rogers Ratio Method compares quantities of different key gases by dividing one into the other. This gives a ratio of the amount of one key gas to another. By looking at the Gas Generation Chart (figure 48), you can see that, at certain temperatures, one gas will be generated more than another gas. Rogers used these relationships and determined that if a certain ratio existed, then a specific temperature had been reached.
By comparing a large number of transformers with similar gas ratios and data collected when the transformers were examined, Rogers then could then say that certain faults were present. Like the key gas analysis above, this method is not a “sure thing” and is only an additional tool to use in analyzing transformer problems.
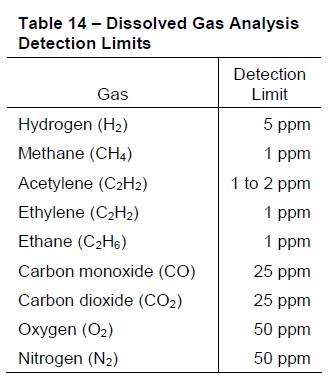
Rogers Ratio Method, using three-key gas ratios, is based on earlier work by Doerneburg, who used five-key gas ratios. Ratio methods are only valid if a significant amount of the gases used in the ratio is present. A good rule is: Never make a decision based only on a ratio if either of the two gases used in a ratio is less than 10 times the amount the gas chromatograph can detect [13]. This rule makes sure that instrument inaccuracies have little effect on the ratios. If either of the gases are lower than 10 times the detection limit, most likely you do not have the particular problem that this ratio represents.
If the gases are not at least 10 times these limits does not mean you cannot use the Rogers Ratios; it means that the results are not as certain as if the gases were at least at these levels.
This is another reminder that DGAs are not an exact science and there there is no “one best, easy way” to analyze transformer problems. Approximate detection limits are as follows, depending on the lab and equipment (table 14).
When a fault occurs inside a transformer, there is no problem with minimum gas amounts at which the ratio is valid. There will be more than enough gas present.
If a transformer has been operating normally for some time and a DGA shows a sudden increase in the amount of gas, first take a second sample to verify that there is a problem. If the next DGA shows gases to be more in line with prior DGAs, the earlier oil sample was contaminated, and there is no further cause for concern. If the second sample also shows increases in gases, the problem is real.
To apply Ratio Methods, subtract gases that were present prior to sudden gas increases. This takes out gases that have been previously generated due to normal aging and from prior problems. This is especially true for ratios using H2 and the cellulose insulation gases CO and CO2 [13], which are generated by normal aging. Rogers Ratio Method Uses the Following Three Ratios.
C2H2/C2H4, CH4/H2, C2H4/C2H6 These ratios and the resultant fault indications are based on large numbers of DGAs and transformer failures and what was discovered after the failures.
There are other ratio methods, but only the Rogers Ratio Method will be discussed since it is the one most commonly used. The method description is paraphrased from Rogers’ original paper [19] and from IEC 60599 [13].
Ethylene and ethane are sometimes called “hot metal gases.” Notice that this fault does not involve paper insulation, because CO is very low. H2 and C2H2 are both less than 10 times the detection limit. This means the diagnosis does not have a 100% confidence level of being correct. However, due to the high ethylene, the fault is probably a bad connection where an incoming lead is bolted to a winding lead, perhaps bad tap changer contacts, or additional core ground (large circulating currents in the tank and core). See the two bottom problems on table 16 (later in this chapter). This example was chosen to show a transformer that was not a “clear cut” diagnosis. Engineering judgment is always required.
CAUTION:
Rogers Ratio Method is for fault analyzing, not for fault detection. You must have already decided that you have a problem from the total amount of gas (using IEEE limits) or increased gas generation rates. Rogers Ratios will only give you an indication of what the problem is; it cannot tell you whether or not you have a problem. If you already suspect a problem, based on total combustible gas levels or increased rate-of-generation, then you normally already will have enough gas for this method to work. A good system to determine whether you have a problem is to use table 9 in the Key Gas Method.
If two or more of the key gases are in Condition 2 and the gas generation is at least 10% per month of the L1 limit, you have a problem. Also, for the diagnosis to be valid, gases used in ratios should be at least 10 times the detection limits given earlier. The more gas you have, the more likely the Rogers Ratio Method will give a valid diagnosis. The reverse is also true; the less gas you have, the less likely the diagnosis will be valid. If a gas used in the denominator of any ratio is zero, or is shown in the DGA as not detected, use the detection limit of that particular gas as the denominator. This gives a reasonable ratio to use in diagnostic table Table 15. Zero codes mean that you do not have a problem in this area.

Notes:
- There will be a tendency for ratio C2H2 /C2H4 to rise from 0.1 to above 3 and the ratio C2H4 /C2H6 to rise from 1-3 to above 3 as the spark increases in intensity. The code at the beginning stage will then be 1 0 1.
- These gases come mainly from the decomposition of the cellulose which explains the zeros in this code.
- This fault condition is normally indicated by increasing gas concentrations. CH4 /H2 is normally about 1; the actual value above or below 1 is dependent on many factors, such as the oil preservation system (conservator, N2 blanket, etc.), the oil temperature, and oil quality.
- Increasing values of C2H2 (more than trace amounts) generally indicate a hot spot higher than 700 °C. This generally indicates arcing in the transformer. If acetylene is increasing, and especially if the generation rate is increasing, the transformer should be de-energized; further operation is extremely hazardous.
General Remarks:
- Values quoted for ratios should be regarded as typical (not absolute). This means that the ratio numbers are not “carved in stone”; there may be transformers with the same problems whose ratio numbers fall outside the ratios shown at the top of the table.
- Combinations of ratios not included in the above codes may occur in the field. If this occurs, the Rogers Ratio Method will not work for analyzing these cases.
- Transformers with on-load tap changers may indicate faults of code type 2 0 2 or 1 0 2 depending on the amount of oil interchange between the tap changer tank and the main tank.
Notice that methane is increasing slowly, but ethane had a large increase between samples 1 and 2 but did not increase between samples 2 and 3. Note that two key gases (CH2 and C2H6) are above IEEE Condition 1 in table 9, so the Rogers Ratio Method is valid. By referring to table 15, this combination of codes is Case 6, which indicates the transformer has a thermal fault in the temperature range of 150 ºC to 300 ºC.
Life history of the transformer must be examined carefully. It is, again, very important to keep accurate records of every transformer.
This information is invaluable when it becomes necessary to do an evaluation.
The transformer in this example is one of three sister transformers that have had increased cooling installed and are running higher loads due to a generator upgrade several years ago. Transformer sound level (hum) is markedly higher than for the two sister transformers. The unit breaker experienced a fault some years ago, which placed high mechanical stresses on the transformer. This generally means loose windings, which can generate gas due to friction (called a thermal fault) by Rogers Ratios.
Comparison with sister units reveals almost triple the ethane as the other two, and it is above the IEEE Condition 4. Gases are increasing slowly; there has been no sudden rate increase in combustible gas production. Notice the large increase in O2 and N2 between the first and second DGA and the large decrease between the second and third. This indicates that the oil sample was exposed to air (atmosphere) and that these two gases are inaccurate in the middle sample.
Carbon Dioxide/Carbon Monoxide Ratio
This ratio is not included in the Rogers Ratio Method of analysis. However, it is useful to determine if a fault is affecting the cellulose insulation. This ratio is included in transformer oil analyzing software programs, such as Delta X Research Transformer Oil Analyst. This analysis is available from the TSC at D-8440 and D-8450 in Denver.
Formation of CO2 and CO from the degradation of oil impregnated paper increases rapidly with temperature. Calculate a normal operating CO2/CO ratio at each DGA, based on the total accumulated amount of both gases. Look at several DGAs concentrating on CO2 and CO. Experience has shown that, with normal loading and temperatures, the CO2 generation rates runs 7 to 20 times higher than CO. With a CO2/CO ratio above 7, there is little concern. With some transformers, ratios down to 5 times more CO2 than CO might be considered normal. However, be careful with a ratio below 7. If H2, CH4, and C2H6 are increasing significantly as well as CO and the ratio is 5 or less, there is probably a problem. Take time to know the particular transformer by carefully checking all prior DGAs and establishing a normal operating CO2 to CO ratio.
CAUTION:
After a suspected problem (a substantial increase in the amount of CO), the ratio should be based on the gas generation of both CO2 and CO between successive DGAs and not on accumulated total CO2 and CO gas levels.
If a problem is suspected, immediately take another DGA sample to confirm the problem. Take the amount of CO2 generated between the DGAs and divide it by the amount of CO generated at that same time to establish the ratio. An excellent indication of abnormally high temperatures and rapidly deteriorating cellulose insulation is a CO2/CO under 5. If the ratio is 3 or under, severe and rapid deterioration of cellulose is certainly occurring. In addition to DGAs, perform the Furans test explained in the following section 7.6.
Extreme overheating from loss of cooling or plugged oil passages will produce a CO2/CO ratio around 2 or 3 along with increasing Furans. If this is found, de-energization and internal inspection is recommended; the transformer is in imminent danger of failure.
Table 16 is adapted from IEC 60599, Appendix A.1.1 [13]. Some of the wording has been changed to reflect American language usage rather than European.

Notes:
- X wax formation comes from Paraffinic oils (paraffin based). These are not used in transformers at present in the United States but are predominate in Europe.
- The last overheating problem in the table says “over 700 °C.” Recent laboratory discoveries have found that acetylene can be produced in trace amounts at 500 °C, which is not reflected in this table. We have several transformers that show trace amounts of acetylene that probably are not active arcing but are the result of high-temperature thermal faults, as in the example. It may also be the result of one arc, due to a nearby lightning strike or voltage surge.
- A bad connection at the bottom of a bushing can be confirmed by comparing infrared scans of the top of the bushing with a sister bushing. When loaded, heat from a poor connection at the bottom will migrate to the top of the bushing, which will display a markedly higher temperature. If the top connection is checked and found tight, the problem is probably a bad connection at the bottom of the bushing.
Moisture Problems
Moisture, especially in the presence of oxygen, is extremely hazardous to transformer insulation. Recent EPRI studies show that an oxygen level above 2,000 ppm dissolved in transformer oil is extremely destructive. Each DGA and Doble test result should be examined carefully to see if water content is increasing and to determine the moisture by dry weight (M/DW) or percent saturation in the paper insulation. When 2% M/DW is reached, make plans for a dry out.
Never allow the M/DW to go above 2.5% in the paper or 30% oil saturation without drying out the transformer. Each time the moisture is doubled in a transformer, the life of the insulation is cut by one-half. Keep in mind that the life of the transformer is the life of the paper, and the purpose of the paper is to keep out moisture and oxygen. For service-aged transformers rated less than 69 kV, results of up to 35 ppm at 60 °C are considered acceptable.
For 69 kV through 230 kV, a DGA test result of 20 ppm at 60 °C is considered acceptable. For greater than 230 kV, moisture should never exceed 12 ppm at 60 °C. However, the use of absolute values for water does not always guarantee safe conditions, and the percent by dry weight should be determined. See table 19, “Doble Limits for In-Service Oils,” in section 7.6. If values are higher, the oil should be processed. If the transformer is kept as dry and free of oxygen as possible, transformer life will be extended.
Reclamation specifies that manufacturers dry new transformers to no more than 0.5% M/DW during commissioning. That means that a transformer with 10,000 pounds of paper insulation, has 10,000 x 0.005 = 50 pounds of water (about 6 gallons) in the paper. This is not enough moisture to be detrimental to electrical integrity. When the transformer is new, this water is distributed equally through the transformer. It is extremely important to remove as much water as possible.
When the transformer is energized, water begins to migrate to the coolest part of the transformer and the site of the greatest electrical stress. This location is normally the insulation in the lower one-third of the winding [6]. Paper insulation has a much greater affinity for water than does the oil. The water will distribute itself unequally, with much more water being in the paper than in the oil. The paper will partially dry the oil by absorbing water out of the oil. Temperature is also a big factor in how the water distributes itself between the oil and paper. See table 17 below for comparison.

Table 17 shows the tremendous attraction that paper insulation has for water and how the water changes in the paper with temperature. The ppm of water in oil shown in the DGA is only a small part of the water in the transformer. When an oil sample is taken, it is important to record the oil temperature from the top oil temperature gauge.
Some laboratories give percent M/DW of the insulation in the DGA; others give percent oil saturation, and some give only the ppm of water in the oil. If you have an accurate temperature of the oil and the ppm of water, the Nomogram (figure 55, section 6.1.11.2) will give percent M/DW of the insulation and the percent oil saturation.
Where does the water come from? Moisture can be in the insulation when it is delivered from the factory. If the transformer is opened for inspection, the insulation can absorb moisture from the atmosphere. If there is a leak, moisture can enter in the form of water or humidity in the air. Moisture is also formed by the degradation of insulation as the transformer ages. Most water penetration is flow of wet air or rain water through poor gasket seals due to a pressure difference caused by transformer cooling.
If a transformer is removed from service during rain or snow, some transformer designs cool rapidly and the pressure inside drops. The most common moisture ingress points are gaskets between bushing bottoms and the transformer top and the pressure
relief device gasket. Small oil leaks, especially in the oil cooling piping, will also allow moisture ingress. With rapid cooling and the resultant pressure drop, relatively large amounts of water and water vapor can be pumped into the transformer in a short time. It is important to repair small oil leaks; the small amount of visible oil is not important in itself, but it indicates a point where moisture will enter [23].
It is critical for life extension to keep transformers as dry and as free of oxygen as possible. Moisture and oxygen cause the paper insulation to decay much faster than normal and form acids, sludge, and more moisture. Sludge settles on windings and inside the structure, causing less efficient transformer cooling, which allows temperature to slowly rise over a period of time. (This was discussed earlier in section section 3.4.5.4). Acids cause an increase in the rate of decay, which forms more acid, sludge, and moisture at a faster rate [21].
This is a vicious cycle of increasing speed forming more acid and causing more decay. The answer is to keep the transformer as dry as possible and as free of oxygen as possible. In addition, oxygen inhibitor should be watched in the DGA testing. The transformer oil should be dried when moisture reaches the values stated in table 19 (following later in this document). An inhibitor (ditertiary butyl paracresol [DBPC]) should be added (0.3% by weight ASTM D-3787) when the oil is processed (see section 7.3).
Water can exist in a transformer in five forms:
- Free water, at the bottom of the tank.
- Ice at the tank bottom (if the oil specific gravity is greater than 0.9, ice can float).
- Water can be in the form of a water/oil emulsion.
- Water can be dissolved in the oil and is given in ppm in the DGA.
- Water can be in the form of humidity if transformers have an inert gas blanket.
Free water causes few problems with dielectric strength of oil; however, it should be drained as soon as possible. Having a water-oil interface allows oil to dissolve water and transport it to the insulation.
Problems with moisture in insulation were discussed above. If the transformer is out of service in winter, water can freeze. If oil specific gravity is greater than 0.9 (ice specific gravity), ice will float. This can cause transformer failure if the transformer is energized with floating ice inside. This is one reason that DGA laboratories test the specific gravity of transformer oil.
The amount of moisture that can be dissolved in oil increases with temperature (see figure 51). This is why hot oil is used to dry out a transformer. A water/oil emulsion can be formed by purifying oil at too high temperature. When the oil cools, dissolved moisture forms an emulsion [21]. A water/oil emulsion causes drastic reduction in dielectric strength.
How much moisture in insulation is too much? When the insulation reaches 2.5% M/DW or 30% oil saturation (given on some DGAs), the transformer should have a dry out with vacuum, if the tank is rated for vacuum. If the transformer is old, pulling a vacuum can do more harm than good. In this case, it is better to do round-the-clock re-circulation with a Bowser drying the oil as much as possible, which will pull water out of the paper. At 2.5% M/DW, the paper insulation is degrading much faster than normal [6]. As the paper is degraded, more water is produced from the decay products, and the transformer becomes even wetter and decays even faster. When a transformer gets above 4% M/DW, it is in danger of flashover if the temperature rises to 90 ºC.
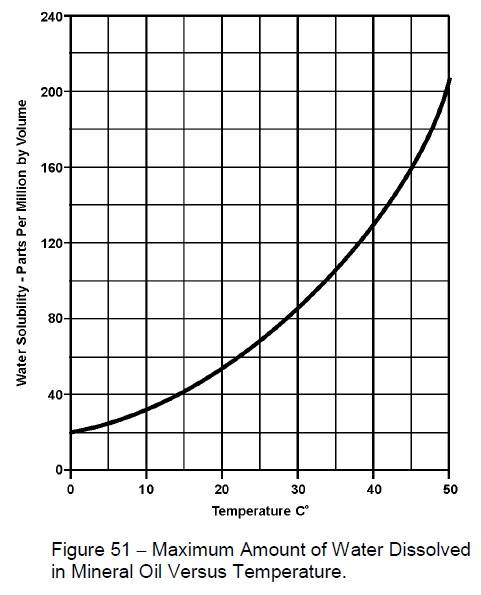
Dissolved Moisture in Transformer Oil – Moisture is measured in the dissolved gas analysis in ppm. Some laboratories also give percent saturation, which is the percent saturation of water in the oil. This is a percentage of how much water is in the oil compared with the maximum amount of water the oil can hold. Figure 51 shows it can be seen that the amount of water the oil can dissolve is greatly dependent on temperature. The curves below (figure 52) are percent saturation curves. On the left line, find the ppm of water from your DGA. From this point, draw a horizontal with a straight edge. From the oil temperature, draw a vertical line.
At the point where the lines intersect, read the percent saturation curve. If the point falls between two saturation curves, estimate the percent saturation based on where the point is located. For example, if the water is 30 ppm and the temperature is 40 ºC, you can see on the curves that this point of intersection falls about halfway between the 20% curve and the 30% curve. This means that the oil is approximately 25% saturated. Curves shown on figure 52 are from IEEE 62-1995 [20].

CAUTION:
Below 30 °C, the curves are not very accurate.
Moisture in Transformer Insulation
Figure 53 shows how moisture is distributed throughout transformer insulation. Notice that the moisture is distributed according to temperature, with most moisture at the bottom and less moisture as temperature increases toward the top. This example shows almost twice the moisture near the bottom as there is at the top. Most service-aged transformers fail in the lower one-third of the windings, which is the area of most moisture. The area of most moisture is also the area of most electrical stress.
Moisture and oxygen are two of the transformer’s worst enemies. It is very important to keep the insulation and oil as dry as possible and as free of oxygen as possible. Failures due to moisture are the most common cause of transformer failures [6]. Without an accurate oil temperature, it is impossible for laboratories to provide accurate information about the M/DW or percent saturation. It will also be impossible for you to calculate this information accurately.

Experts disagree on how to tell how much moisture is in the insulation based on how much moisture is in the oil (ppm). At best, methods to determine moisture in the insulation based solely on DGA are inaccurate.
Metods insulation
The methods discussed below to determine moisture levels in the insulation are estimates, and no decision should be made based on one DGA. However, keep in mind that the life of the transformer is the life of the insulation. The insulation is quickly degraded by excess moisture and the presence of oxygen. Base any decisions on several DGAs over a period of time and establish a trend of increasing moisture.
If the lab does not provide the percent M/DW, IEEE 62-1995 [20] gives a method. From the curve (figure 54), find the temperature of the bottom oil sample and add 5 ºC. Do not use the top oil temperature. This estimates the temperature of the bottom third (coolest part) of the winding, where most of the water is located.

From this temperature, move up vertically to the curve. From this point on the curve, move horizontally to the left and find the Myers Multiplier number. Take this number and multiply the ppm of water shown on the DGA. The result is percent M/DW in the upper part of the insulation. This method gives less amount of water than the General Electric nomogram (figure 55).
This nomogram, published by General Electric in 1974, gives the percent saturation of oil and percent M/DW of insulation. Use the nomogram to check yourself after you have completed the method illustrated in figure 54. The nomograph in figure 55 will show more moisture than the IEEE method.
Relationships between temperature
The curves in figure 55 are useful to help understand relationships between temperature, percent saturation of the oil, and percent M/DW of the insulation. For example, pick a point on the ppm water line (10 ppm). Place a straight edge on that point and pick a point on the temperature line
(45 ºC). Read the percent saturation and percent M/DW on the center lines. In this example, percent saturation is about 6.5%, and the % M/DW is about 1.5%. Now, hold the 10 ppm point and move the sample temperature upward (cooler) and notice how quickly the moisture numbers increase.
For example, use 20 ºC and read the percent saturation of oil at about 18.5% and the % M/DW at about 3.75%. The cooler the oil, the higher the moisture percentage for the same ppm of water in the oil.

Transformer Oil Nomogram
Do not make a decision on dry out based on only one DGA and one calculation; it should be based on trends over a period of time. Take additional samples and send them for analysis. Take extra care to make sure the oil temperature is correct. You can see by the nomogram that moisture content varies dramatically with temperature.
Take extra care that the sample is not exposed to air. After using the more conservative IEEE method, if, again, subsequent samples show M/DW is 2.5% or more and the oil is 30% saturated or more, the transformer should be dried as soon as possible. Check the nomogram and curves above to determine the percent saturation of the oil. The insulation is degrading much faster than normal due to the high moisture content. Drying can be an expensive process; it is prudent to consult with others before making a final decision to implement dry out. However, it is much less expensive to perform a dry out than to allow a transformer to degrade faster than normal, substantially shortening transformer life.
Why it is necessary to clean transformer oil
Providing good operating conditions for transformers, transformer oil takes on the influence of negative factors: high temperature, high loads, oxidation, critical stresses, etc. This explains the difference between maintenance of oil and transformer. The transformer can work without maintenance for up to 10-15 years, when oil requires processing after a year, and a full regeneration after 4-5 years. To solve these problems, it is advisable to use CMM plants by GlobeCore. CMM-R plant connects directly to a transformer, and restores the properties of oil without draining it from a tank. In this case, the transformer can stay on-line and off-line

Transformer oil life could be extended by the following measures:
1) exclude contact of oil with oxygen, by installing special expanders with filters;
2) reduce oil overheating as much as possible;
3) regular cleaning from sludge and water;
4) reduce acid content by using continuous filtration processes;
5) add antioxidant to oil.
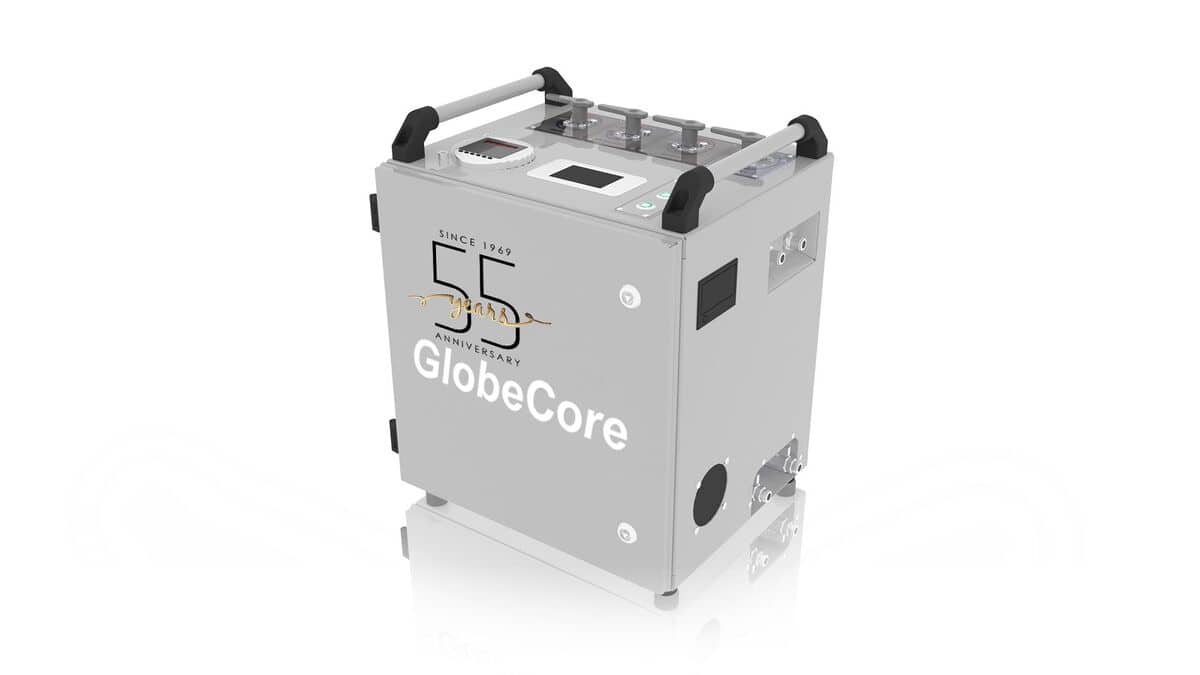
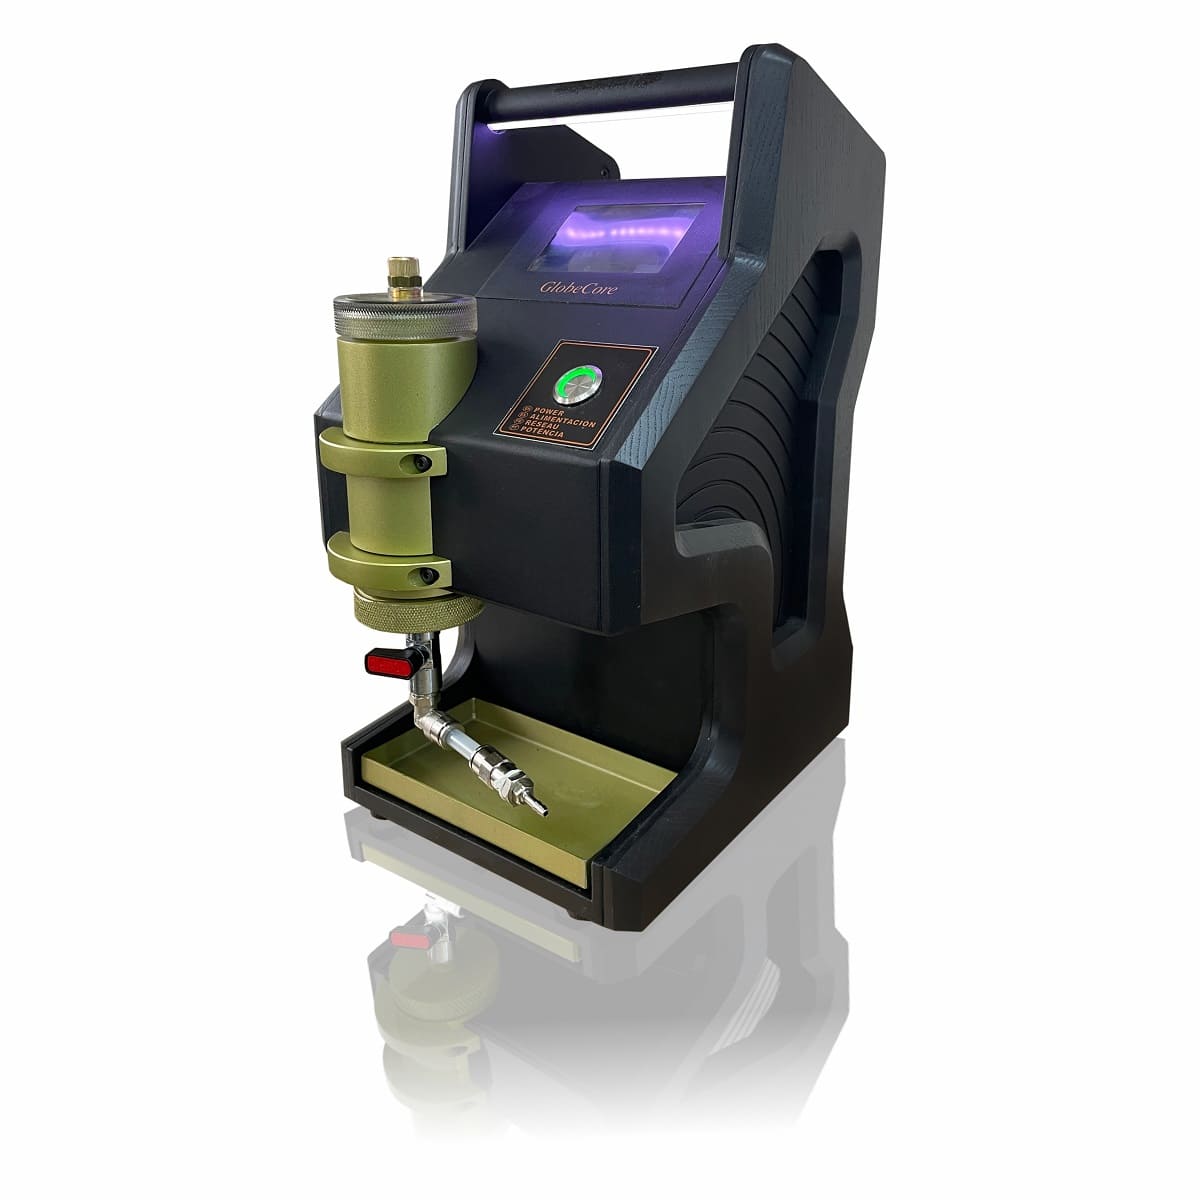
Globecore Company
GlobeCore equipment maximizes effective cleaning and regeneration of transformer oil. through a combination of thermal vacuum treatment, multistage filtration and adsorptive purification. The last stage is very important since it removes acidic components and aging products in oil for complete restoration of oil properties.
Adsorbents perform a complete polishing of oil by removing these impurities. After such treatment the oil is suitable for further use in power transformers and oil circuit breakers.
Being guided by modern demands in cleaning and regeneration of transformer oil , GlobeCore manufactures equipment in different designs: mobile (on wheels, trailer, rollers), stationary, explosion-proof, thermally insulated, etc. All units are equipped with modern sensors and control system for processing transformer oil.